From model attribution to chemical meaning
A useful explanation connects a defined region → a physical quantity → a model-supported trend → a testable hypothesis. Start with the sulfur example, then use the recorded teaching outputs below to practice reading attribution.
1. A sulfur-centered question
Ask: does the local electrostatic environment around sulfur help distinguish molecular additives once whole-molecule size and exposure are considered? Select sulfur before modeling; see the six structures in Case 2 · Sulfur-centered surfaces.
S_ESP_average has a readable definition: select S atoms, read the average ESP
on each assigned atomic surface, then average those values over the S atoms.
The public extractor reads ESP All average (kcal/mol) and implements this in
surfacia/features/atom_properties.py. It is not a sulfur atomic charge.
With multiple S atoms, this implementation averages atom-level statistics;
its min/max columns are not the molecule-wide extrema over all S surface points.
An explanation card should answer four questions:
Where? The surface regions assigned to sulfur, with atom IDs retained.
What? ESP in the generating program's units and the stated aggregation rule.
What does the model show? Importance, signed SHAP trend, observed range, coverage and uncertainty, checked alongside global descriptors.
What could test it? Compare matched molecules that change the local environment while limiting size/shape changes; test the target independently.
This is a chemical question and reading template, not a new electrocatalytic result. The molecular descriptor alone does not establish adsorption geometry, an additive–Cu interaction mechanism, or a causal selectivity rule.
For a conserved organocatalyst core, apply the same chain to a predefined fragment. For a prior-free property such as solubility, compare generic descriptors too; local surface information is not guaranteed to be the most useful representation.
2. Read an actual output
The following numbers come from the downloadable Case 1 · Descriptor table to predictions and SHAP run: 36 public structures, six RDKit features and computed Crippen logP. This lightweight exercise teaches attribution reading; it is not a quantum-surface case.
Field |
Value and meaning |
|---|---|
SMILES |
CCCCCO |
RDKit Crippen logP |
1.1689 |
Prediction |
1.2970 |
MolWt |
88.15 g/mol; SHAP +0.5745 |
TPSA |
20.23 A²; SHAP -0.2817 |
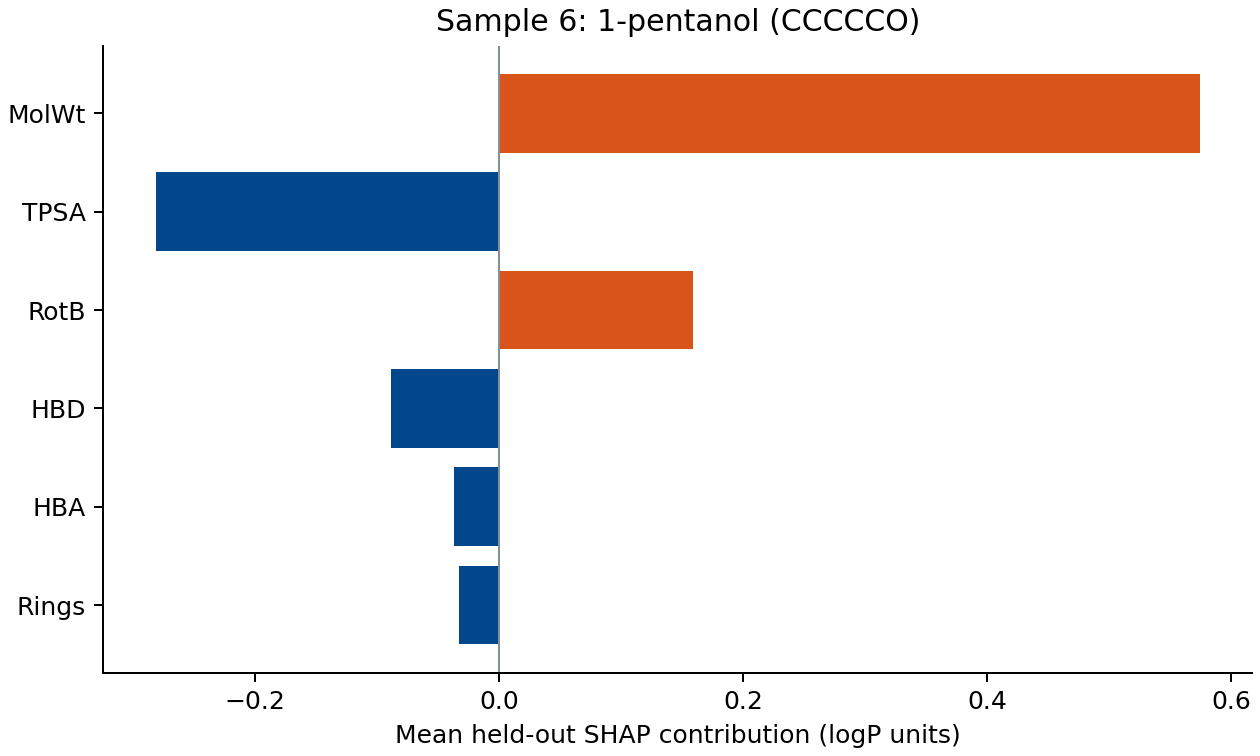
The molecular-weight term raises this model's prediction relative to its baseline; the TPSA term lowers it. Inspect all six contributions, rather than presenting one as a mechanism.
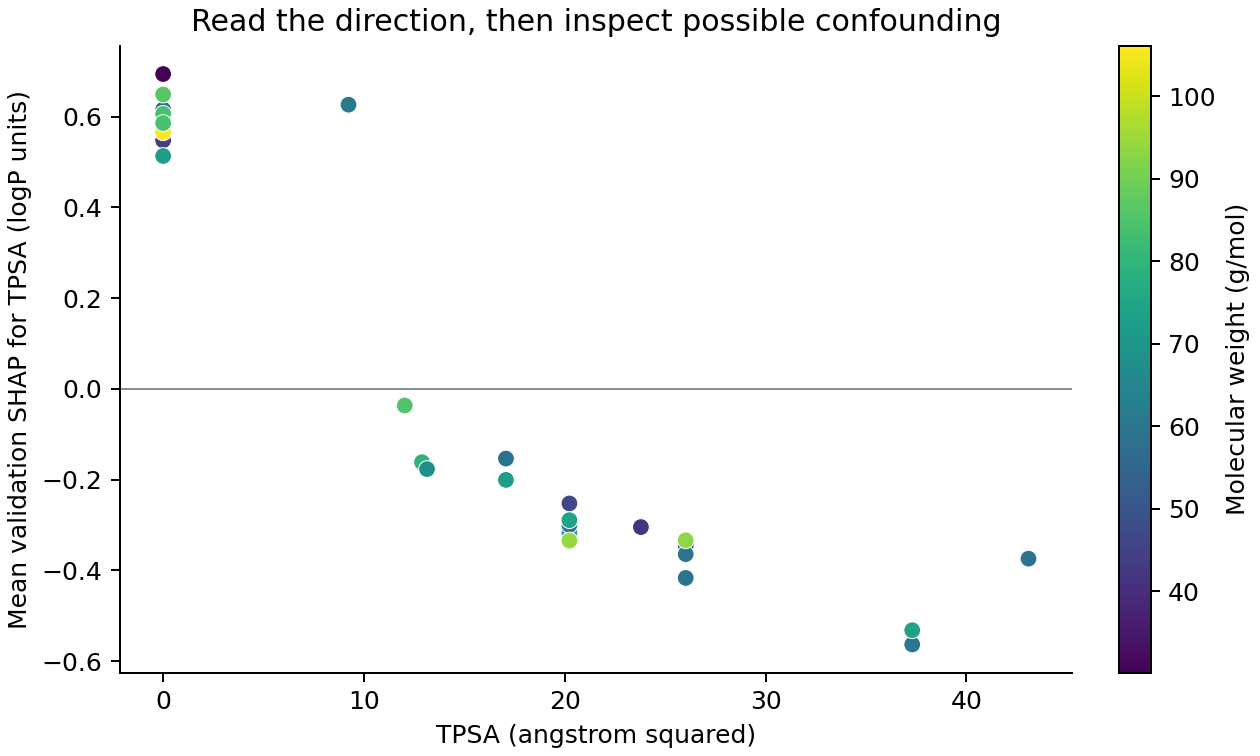
Across the modeling pool, inspect direction and possible size confounding. A dependence plot is observational; changing TPSA alone is not an intervention.
Read mean(abs(SHAP)) as influence magnitude, signed SHAP as direction relative
to the model baseline, and SHAP_Std_* as between-model dispersion, not a calibrated
confidence interval. Positive SHAP does not mean a universally beneficial chemical change.
The held-out R² of this small teaching run is only 0.076; the numerical card is not
evidence of reliable generalization or experimental accuracy.
Open the same data interactively
Save the two CSVs with the names above and create an empty structures directory.
SMILES provide 2D drawings; actual surface files are required for a 3D surface view.
surfacia shap-viz -i Training_Set_Detailed_demo.csv -x ./structures --test-csv Test_Set_Detailed_demo.csv --skip-surface-gen --host 127.0.0.1 --port 8052
Open http://127.0.0.1:8052, select TPSA or MolWt, then select sample 6. Compare its structure, value and attribution with other samples. No API key is needed for this local plot.
3. Turn a readable card into research evidence
The latest article evaluates prediction and interpretability separately. Its research pipeline adds shared frozen splits, validation-only attribution, XGBoost/TreeSHAP and MLP/DeepSHAP, perturbation checks and blinded LLM assessment. MLP SHAP backgrounds come only from the corresponding training fold. These are separate research scripts, not extra switches of the public viewer.
The six assessment questions are: chemical semantics, mapping specificity, attribution support, cross-model robustness, experimental testability and control of claims. LLMs evaluate fixed, anonymized evidence cards; they do not generate the quantum descriptors or replace experimental validation. An LLM preference is evidence about explanation utility, not proof of a mechanism or equivalence to a human expert.
Use this protocol to ask better questions of your own data. The teaching case does not run MLP, perturbation tests or LLM scoring, and does not redistribute unreleased research tables or manuscript figures. See The workflow · Keep the chemical question in view for the end-to-end path and Read model outputs for output details.